
When Weiss Engineering introduced the Weiss EQ1 the objective was to create the reference unit to all digital mastering EQs. No expense was spared in this project, and the result is as legendary as the effort. EQ1 became, and still is, a mainstay in the rig of the modern mastering engineer. And while the mixing engineer needs the same fidelity as the mastering engineer, the mastering workflow is quite different from the mix engineer’s needs. The Weiss EQ MP is the answer to that. It’s EQ1, but designed for mix engineers.
Weiss EQ MP runs the same code as Weiss EQ1, including the high fidelity low-noise algorithms, but we’ve removed mastering specific use-cases and focused on the everyday needs of the mix engineer.
Sound quality and high fidelity are the highest priority, but workflow is almost as important. EQ MP was created to get the job done, lets you make the correct decisions, while being safely assured that the sound quality is the highest.
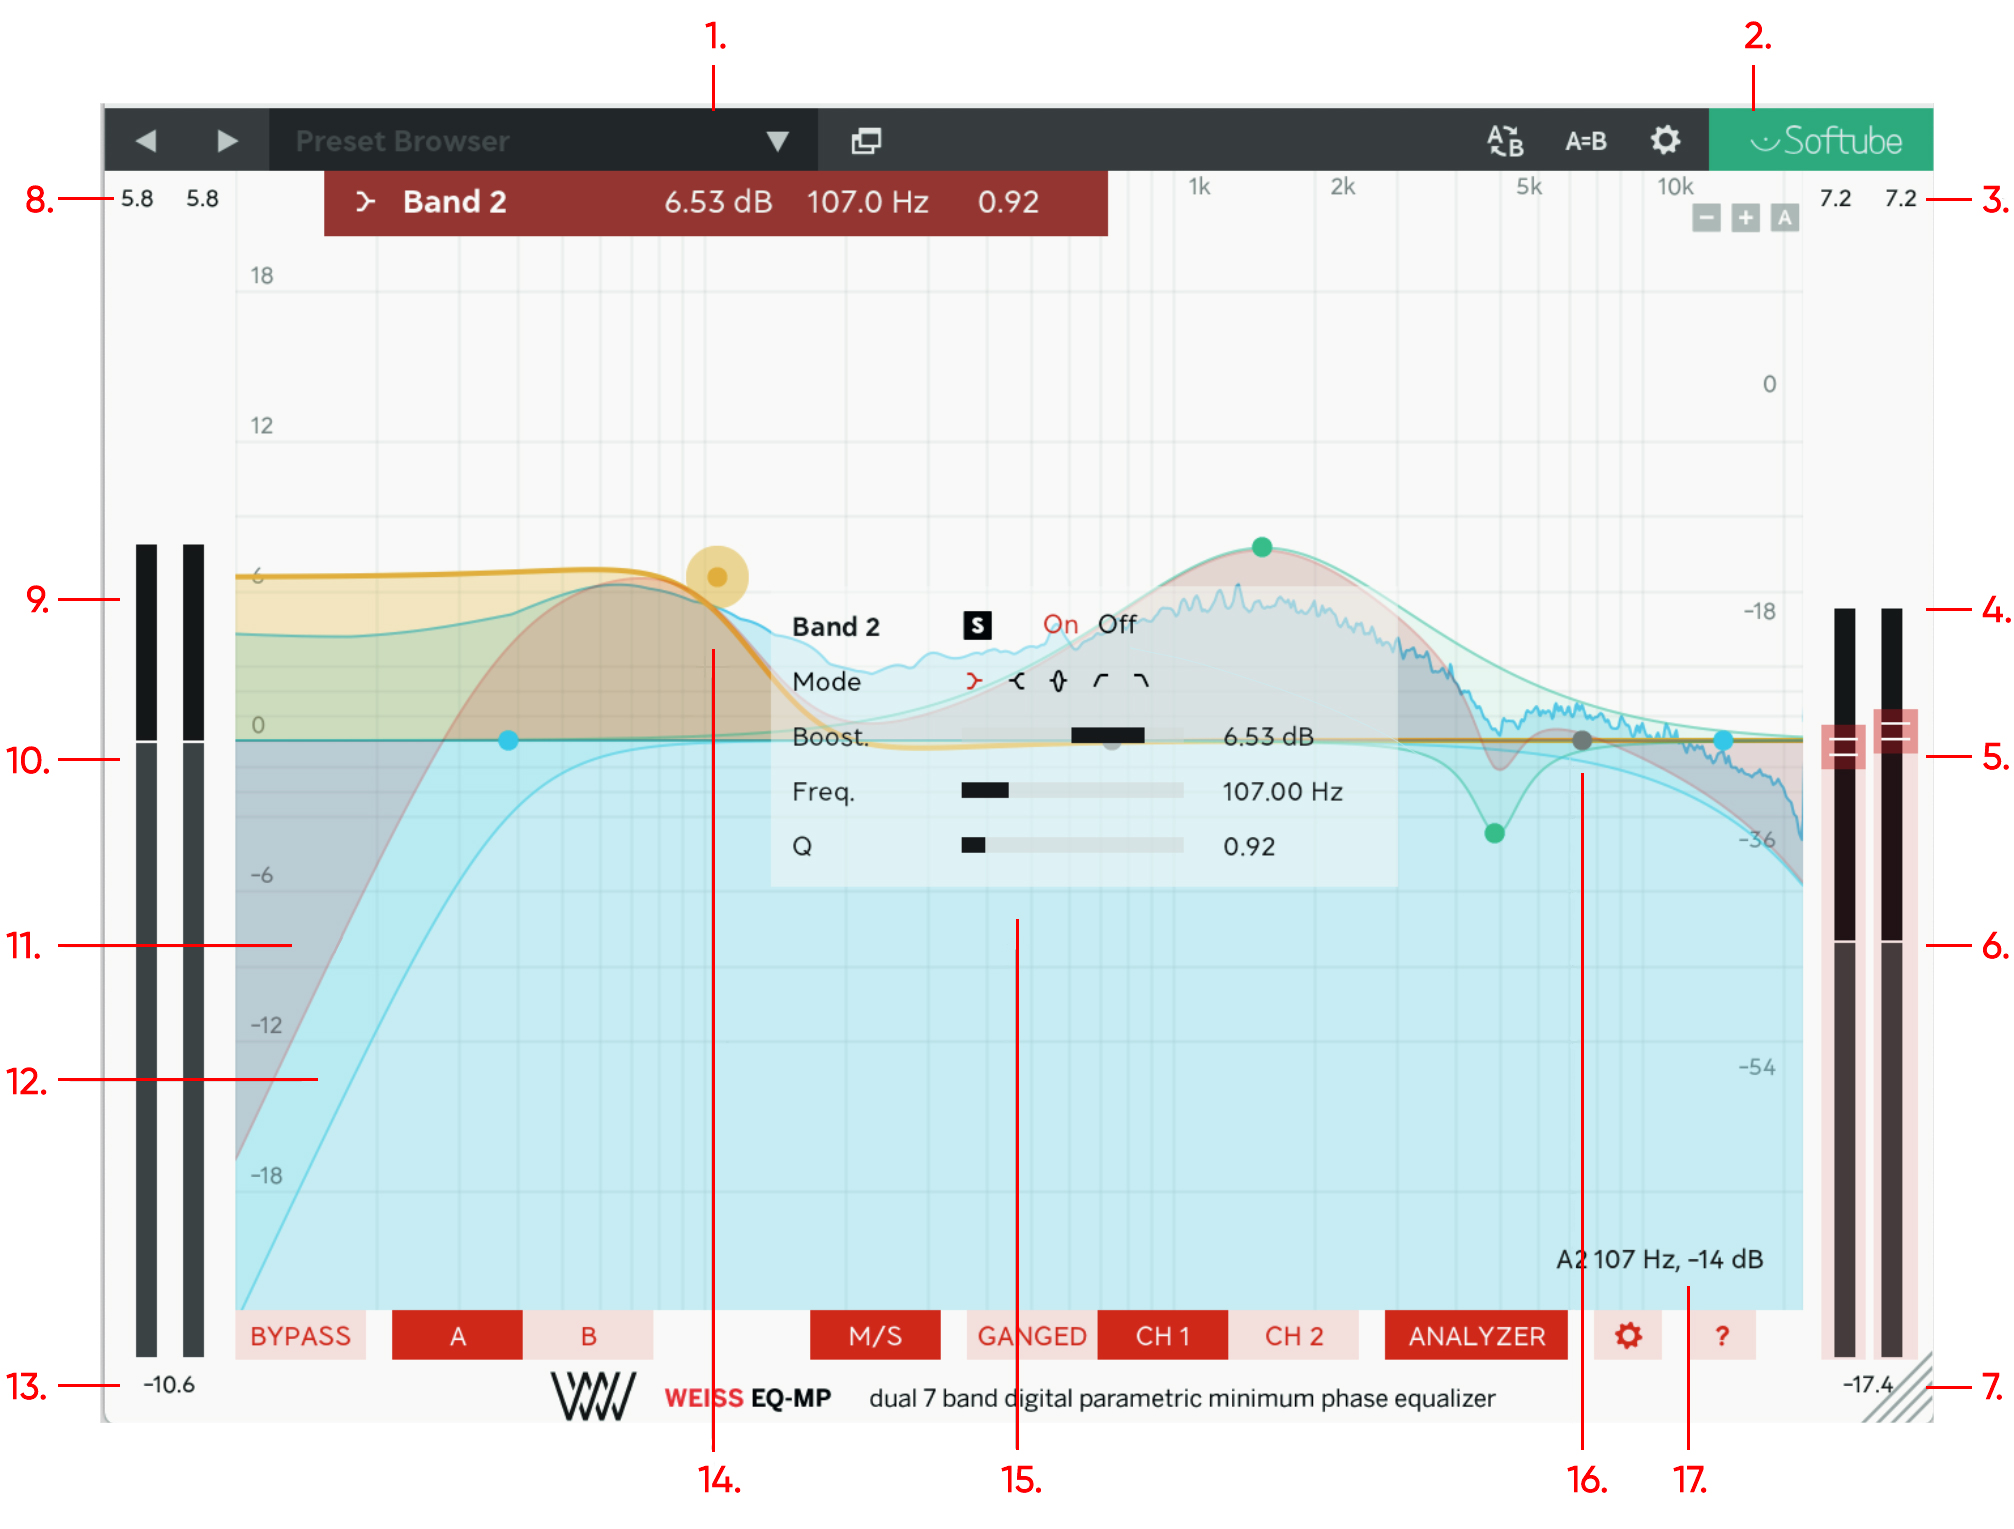
The user interface should feel very familiar to a mix engineer. It has a large area that shows the EQ curve and the frequency analyzer, you can click and drag on a handle to change the EQ of that band.
Each band is color coded after the type of the filter, a bell-shaped filter is green, a shelving is yellow, and the cuts are blue. The sum of all bands is shown as a red curve. Clicking on the handle will reveal a small menu for each band if you want to use another mode of input instead of clicking and dragging the handle.
On both sides of the curves you find the metering: input metering to the left and output metering and volume to the right.
To make the window larger or smaller, just click and drag the handle in the lower right corner!
Click here to view the full-sized image in a new tab.
- EQ Band Summary
- EQ Window Zoom
- Output Peak Level
- Output Peak Level
- Output Volume
- Output RMS Level
- Output RMS Level
- Input Peak Level
- Input Peak Level
- Input RMS Level
- Combined EQ Curve (red)
- Frequency Analyzer
- Input RMS Level
- Currently selected EQ band
- EQ Band Menu
- Disabled band (gray dot)
- Mouse position
EQ Bands
Each of the seven EQ bands can be set to cut, peak and shelving modes, and all bands are equal. There are many different ways to adjust the parameters, and the fastest way is just to click and drag the curve to change frequency and gain, and use the mouse scroll-wheel to adjust the Q or slope of the filter.
The bands are color coded after band type:
- RED: The total EQ response
- GREEN: Peaking filter
- BLUE: Cut filter
- YELLOW: Shelving filter
- GRAY: Disabled band
Filter Type: Sets the type of the filter:
LOW SHELF/HIGH SHELF: Shelving filter, anything from super-smooth to super-resonant.
PEAK: bell-shaped filter, very wide or extremely sharp depending on the Q value.
HIGH PASS/LOW PASS: minimum phase cut-filters, ranging from a smooth 6 dB/octave to a brickwall Butterworth type 96 dB/octave filter.
Boost: Sets the gain of the peaking or shelving filter. Not applicable to cut filters.
Frequency: Sets the center frequency of peaking filters, or the cut-off frequency for cut and shelving filters.
Q/Slope: Sets the sharpness/resonance of the peaking filter, the resonance of the shelving filter, or the slope of the cut filter. The cut filters have the following slopes: 6, 12, 24, 48, 96 DB/OCT.
Solo On/Off (“S”): Solo the current band.
Solo works by auditing the difference between unprocessed audio and the changes on the current EQ band. That means that if you have very small changes, the sound level of the soloed band will be low – because the changes are small!
On/Off: Disable the current band.
Keyboard and Mouse Commands
The preferred way to adjust the bands is to click and drag the EQ curve and using the following keyboard modifiers. These are also listed if you click the “?” button in the user interface.
CLICK AND DRAG ON HANDLE: Adjusts the Frequency (horizontal movement) or Boost (vertical movement).
SCROLL WHEEL: Adjust the Q/Slope, also possible by using the COMMAND (macOS) or CONTROL (Win) modifier key.
CLICK AND DRAG IN WINDOW: Selects multiple bands at the same time. Selected band’s handles turn red to indicated that they are selected.
DOUBLE-CLICK: Turn band on/off.
SHIFT-CLICK WHILE DRAGGING: Lock changes in either Boost or Frequency, depending on what you start to adjust. By holding SHIFT while adjusting Frequency (dragging the handle horizontally) you restrict the changes to Frequency and do not risk adjusting the Boost.
OPTION + COMMAND + CLICK (macOS), ALT + CONTROL + CLICK (Win): Solo the current band.
OPTION + CLICK (macOS), ALT + CLICK (Win): Reset the band’s gain to 0 DB.
Bypass: Bypass the processing of all the bands and Output Volume.
A/B: Switch between settings stored in A and B for easy comparison.
Mid/Side: Engage the Mid/Side routing mode, where CH 1 affects the MID (L+R) and CH 2 affects the SIDE (L-R).
Ganged: Link the controls to both channels.
Ch 1/Ch 2: Adjust the controls of respective channel (CH 1 is LEFT or MID, CH 2 is RIGHT or SIDE).
Analyzer: Turns the frequency analyzer ON/OFF.
Options: Display additional settings and options (see chapter below).
Help (“?”): Shows an overview of the key commands.
Output Volume: Set the output gain of the plug-in. In GANGED mode both channels are adjusted with the same amount, in UNGANGED mode you can adjust each channel individually.
Options
Copy: Copy settings either between the two “A” and “B” slots, or between CH 1 and CH 2.
TIP: If you need different settings for the two channels but was previously using Ganged mode, click “COPY CH1 TO CH2” before setting Ganged to OFF.
Analyzer Input/Output: Sets whether the analyzer shows the input audio (before processing) or output (post processing).
Analyzer Tilt: Tilts the display of the entire frequency spectrum.
Many mix engineers prefer to have this set at +3 dB because that corresponds better to what the ear hears (we’re more sensitive to high frequencies). A 3 dB Tilt will show pink noise as being flat. Most analyzers does not use Tilt, so that will correspond to 0 dB Tilt.
Analyzer Mode:
FAST: The fastest mode that will display the frequency changes in real time.
SLOW: A normal analyzer setting which will take a second or so to react but will show a much smoother and less distracting curve.
HOLD AVG: Extremely slow, good to see the overall frequency distribution of a whole song or finding resonances in a drum kit. Click somewhere on the frequency display to reset it.
HOLD PEAK: Fast (zero) attack time, but extremely slow release.
User Interface Weiss/Dunkel: Sets a bright (Weiss) or dark (Dunkel) user interface.
Band Menu: By default, the band menu is activated by left-clicking on the EQ curve’s handle. This can be changed to be either on right-click, on mouse over or to always show the band menu (PERSISTENT).
These options are automatically saved for all instances of Weiss EQ MP.
Window Zoom
In the top right corner of the window you have three buttons: “-“, “+” and “A”. Use these to zoom in/out vertically in the EQ curve display. This does not affect the frequency analyzer.
Zoom in (“+”) or out (“-“) in the dB range of the EQ curves. “A” activates automatic zoom.
The meters to the left display the input levels, and those to the right show the output. Meters always show LEFT and RIGHT levels, regardless of the MID/SIDE configuration.
The black meters shows the peak levels and peak hold (black line) and the gray meter (with white line) shows the RMS.
The numbers above the meters display the peak hold value (dBFS) and below is the RMS dBFS value, averaged between the two input channels.
EQ Bands vs. Frequency Analyzer
The EQ Bands and Frequency Analyzer uses two different vertical scales, since EQ changes are often small compared to the incoming audio. On the left side of the display is the vertical scale for the EQ curve, which is adjustable with the Zoom function (“+”, “-“ and “A”).
On the right y-axis is the scale for the frequency analyzer, from +18 dB to -72 dB. It’s this mouse position read-out you see together with the frequency and musical note in the lower right corner.
A whole range of added control can be accessed with Extended Features. Please see the separate "Extended Features" manual for more information.
Björn Rödseth – DSP programming
Anton Eriksson – DSP programming
Filip Thunström – UI programming
Johan Bremin – Quality assurance, presets
Tobias Menguser – Presets
Niklas Odelholm – Product design